Monday, September 8, 2008

Analysis using MATLAB

Performing matrix computation in MATLAB© is not difficult. However, the direct modeling of a physical structure in MATLAB© is very complicated. ANSYS© model directly corresponds to the geometry and material properties of the physical structure. Its FEM analysis is accurate and reliable. But performing complex matrix computation directly in ANSYS© is not possible. So it is necessary to extract model in MATLAB© from the FEM analysis in ANSYS©.

Obtaining Nodal Solution using MATLAB

We obtain the first six natural frequencies of the integrated structure by modal analysis as they are more relevant. Nodes that are along the central axis in the X direction and on the surface of the beam are selected. As the number of element divisions along the x axis is 60, the number of nodes selected would be 61. As consideration of all the nodes would increase computation effort and time, eleven equidistant nodes are selected. The displacement of each node from the equilibrium position, for each of the six frequencies is calculated and stored as an Eigen vector file. The values of all the six frequencies are stored as a frequency file. As expected the displacement of the end nodes is zero for all frequencies.

Obtaining D.C. Gain using MATLAB

All the Eigen vector values for the six frequencies are uploaded in the MATLAB© Workspace. All the frequencies obtained might not contribute to the systems disturbance significantly. Hence, only the frequencies that dominate are selected. This selection is made on the basis of the D C Gain value for each mode. This D C Gain value is now calculated using MATLAB©. It is assumed that the force is applied at the node, which for a particular mode, is peak. As the case is of simply supported, again the same node is selected for the output. Now, the D C Gain is given as follows[8]:

D C Gain is calculated for each mode shape. D C Gain values obtained for each mode are as follows:


Graph of D.C. Value v/s Frequency is plotted.

MATLAB© plot for DC value vs. Mode number

From the graph, it is observed that as the mode number increases there is a significant decrease in DC Gain value. High frequency modes have less nodes displacement. For a given structure, modes with negligible D C Gain value do not contribute much to the disturbance. Hence, these high frequency modes can be ignored for controlling purpose.

Filtering of Significant Modes using MATLAB

We rank the relative importance of the contribution of the each of the individual mode. The elimination of low D C value modes is performed iteratively. It is necessary that after elimination of high frequency modes there should be no significant in response of system. It is observed that last three modes have negligible D C Gain value, hence these modes are eliminated. Transient response result for all modes included and first 3 modes included are obtained. For transient analysis, node3 is selected for application of the force and same node is considered for output.


Graph shows the magnitude of displacement for node 3 with respect to frequency. Five peaks in the graph signify five modes of vibration.


MATLAB© result for node 3 displacement with respect to time is plotted. The disturbance vanishes at 2.5 sec. Same analysis is repeated again, but including only first 3 modes.


Graph shows the magnitude of displacement for node 3 with respect to frequency. Three peaks in the graph signify three modes of vibration.


MATLAB© result for node 3 displacement with respect to time is plotted for all modes included model and first three modes included model on same graph. It is observe that there is no significant difference in response.

Hence, for given structure, first three modes are of importance for controlling purpose.

Obtaining Reduced Model using MATLAB

Although there is no significant difference observed for response of three modes included system, still an error is introduced as D C gain contribution of eliminated modes are not included in overall D C Gain. In order to eliminate this error, the MATLAB© function “modred” (MODel order REDuction) is introduced. In “modred” function assumptions are made are made about some modes being more important than other. This allows reducing size of the problem to that of the “ important modes”, while adjusting the overall D C Gain to account for the D C Gains of eliminated modes. The “mdc” or “Matched DC” gain option for the function “modred” reduces defined states by setting the derivatives of the state to be eliminated to zero, then solving for remaining states[8].

The other option for “modred” is the “del” option, which simply eliminates the defined states, typically associated with high frequency modes.


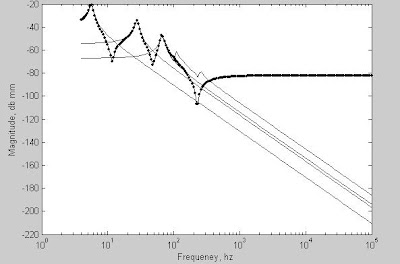
Graph shows the node 3 displacement for three modes included model, using modred “del” option, where three high frequency modes are eliminated. It is observed that at high frequency the reduced curve attenuates with frequency similar to “all modes” curve.


Graph shows the node 3 displacement for three modes included model, using modred “mdc” option. A rise in the high frequency portion of the magnitude curve as a result of the reduction is observed.


Response of node 3 for all modes included model, three modes included model with “mdc” option and three modes included model with “del” option are plotted on same graph. No visible difference in transient analysis is observed.

Design by Dzelque Blogger Templates 2007-2008